
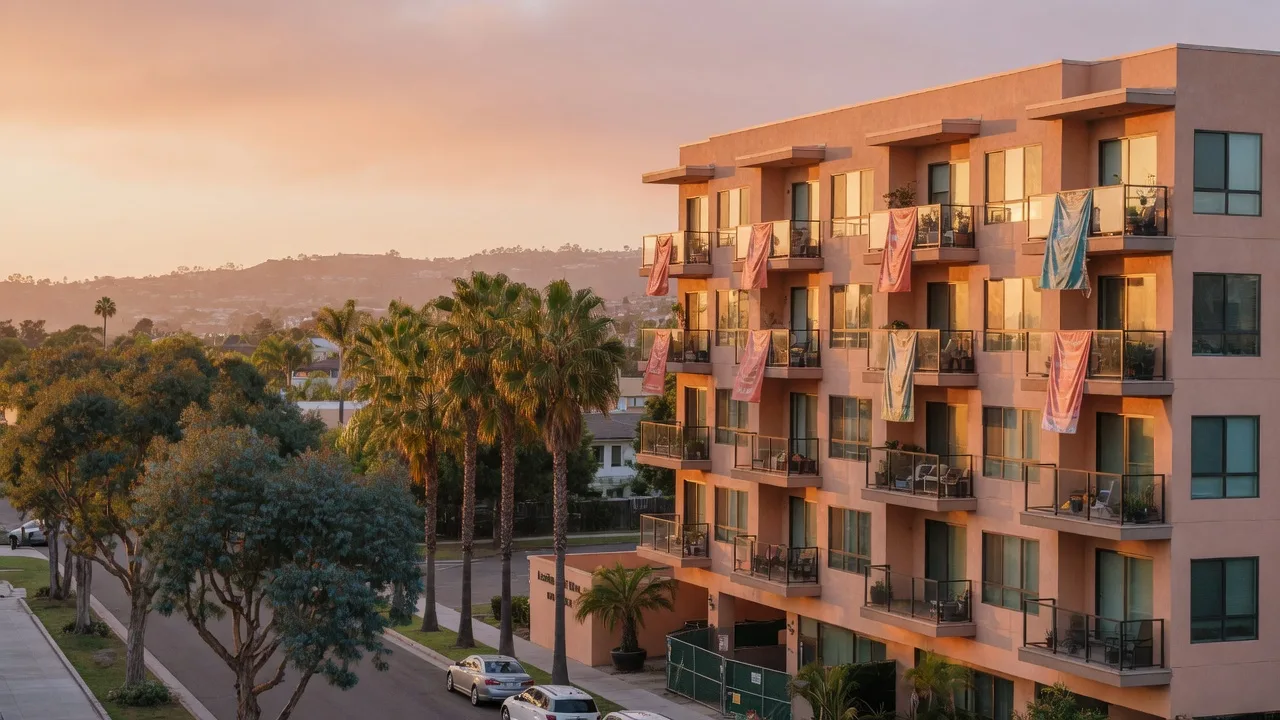
The vacancy peak passes, doors reprice, and commercial splits three ways.
San Diego apartment vacancy turned down for the first time this cycle, average price per door fell almost 19% in a year, and transaction volume is coming back. Inside the same quarter, office, industrial, and retail each moved on its own clock. Here is the Q4 2026 playbook for both asset classes.
Two facts anchor Q4 2026 for apartment and commercial investors. First, the vacancy peak is behind us: Kidder Mathews measured San Diego multifamily vacancy at 5.0% in Q3 2026, down from 5.5% in Q2 and 5.3% a year earlier, the first meaningful improvement of this cycle, even as CoStar’s separate countywide reading stayed elevated at 6.2% through mid-year, the highest in more than 25 years of data. Second, prices have repriced: average price per door fell about 18.9% year over year to roughly $272,000, and Q3 transaction activity accelerated, bringing year-to-date counts back in line with 2025. At the same time, with the 30-year fixed near 7.28%, the commercial market is three separate stories: office stabilizing off the bottom, industrial absorbing a supply wave led by Amazon’s million-square-foot Otay Mesa delivery, and retail, the tightest sector at about 4.3% to 4.6% vacancy, redeveloping rather than rebuilding. This guide walks through the apartment data, the repricing, the commercial sectors, and the year-end checklist.
Kidder Mathews measured county vacancy down from 5.5% in Q2 and 5.3% a year ago, the first meaningful improvement of this cycle, even as CoStar kept its record 6.2% mid-year reading.
Average sale prices per unit fell about 18.9% year over year to roughly $272,000 in Q3 2026, the scale of repricing usually reserved for a downturn.
Average cap rates edged up from 4.8% in Q2, with typical deals from about 4.25% to 6.25% and more yield inland.
Office is stabilizing off the bottom, industrial is absorbing a supply wave, and retail is the tightest sector at roughly 4.3% to 4.6% vacancy.
Multifamily and commercial move on different clocks, but in Q4 2026 they share one theme: repricing. After two years of rising vacancy and costlier capital, both markets are mid-transition, and the opening is going to buyers with capital.
The apartment cycle has reached its inflection. San Diego spent two years absorbing the biggest delivery wave in a generation, and vacancy climbed to a quarter-century high by mid-2026. Then the numbers turned. Kidder Mathews put Q3 county vacancy at 5.0%, down from 5.5% in Q2 and 5.3% a year earlier, with asking rents up about 1.4% year over year. Forecasters expect vacancy to settle near 5% for the full year, and effective rents to rise roughly 1.2%, reversing the near-2% decline of 2025.
The repricing is the part that matters most to buyers. Average sale prices per unit fell about 18.9% year over year to roughly $272,000 in Q3, and trailing-year figures sit near $362,000 to $365,000 against a 2022 peak around $385,600. Average cap rates edged up to about 4.9%. When prices fall this much and transaction volume turns back up, the market is usually telling you the bid-ask gap has closed.
Commercial is not one market this quarter, it is three. Office vacancy still runs roughly 14% to 15% countywide, but absorption finally turned positive and the bottom is being tested. Industrial vacancy reads 7% to 9% as a supply wave, anchored by Amazon’s roughly one million square foot Otay Mesa build-to-suit, leases through, and SoCal industrial posted a five-year leasing high. Retail is the tightest sector at about 4.3% to 4.6% vacancy with rents up around 5.6% year over year, and the play is repositioning, not new supply.
None of this works without realistic money. At a 30-year fixed near 7.28%, every levered deal lives or dies on the gap between borrowing cost and cap rate, which is why the assets clearing today are the ones that cash flow at current rents. The rest of this guide lays out the apartment data, the deal benchmarks, the commercial sectors, the risks, and the year-end calendar.
The vacancy peak is behind the market.
Two trackers disagree on the exact vacancy level, and that matters less than the direction they share. Every row below is a current figure for late 2026.
| Metric | Current Reading | What It Means |
|---|---|---|
| Q3 2026 vacancy, Kidder Mathews | 5.0% | Down from 5.5% in Q2 2026 and 5.3% a year earlier. The first meaningful quarterly improvement of this supply cycle. |
| Mid-2026 countywide vacancy, CoStar | 6.2% | The highest reading in more than 25 years of data, peaking as the delivery wave crested. Trackers differ, but the direction is the story. |
| Q3 asking rent, Kidder Mathews | About $2,462 per unit | Up about 1.4% year over year as rents firmed after the roughly 2% effective-rent decline of 2025. |
| September asking rent, CoStar | About $2,597 | Down 0.2% month over month after eight straight months of growth, still about 1.4% above a year earlier. |
| Full-year vacancy forecast | About 5.1% (Moody’s) | Forecasters expect the year to settle near 5%, with vacancy improving into 2027 as deliveries taper. |
| 2026 effective-rent forecast | About +1.2% | A reversal of the near-2% decline recorded in 2025, even as concession pressure persists in Class A. |
| Class A vs. workforce vacancy | About 11.4% vs. 2.5%–4.0% | Four- and five-star buildings carry the pain; Class B and C workforce product stays tight, which is where yield survives. |
Doors fell almost 19% in a year, and buyers came back.
The price adjustment is the story of the quarter. Volume recovering at these prices is how you know the market has found its level.
| Metric | Current Reading | What It Means |
|---|---|---|
| Average price per unit, Q3 2026 | About $272,000 | Kidder Mathews reported the Q3 average down about 18.9% year over year, the clearest single number for the repricing. |
| Trailing-year price per unit | About $362,000 to $365,000 | ACI and Matthews put the trailing twelve months near $362K to $365K per unit, versus a 2022 peak around $385,600. |
| Average cap rate, Q3 2026 | About 4.9% | Up from 4.8% in Q2 and roughly level with 5.0% a year earlier. Higher for value property, lower for coastal core. |
| Sales volume trend | Accelerating in Q3 | Third-quarter transaction activity brought year-to-date counts back in line with 2025 after a slow start. |
| Largest Q3 2026 trade | Gema at Cortez, 230 units, about $80M | Roughly $348,000 per unit, a benchmark for urban-core product in the current repricing. |
| Trailing-twelve-month volume | About $2.52B (as of Q2 2026) | Matthews tracked the trailing year just above $2.5 billion, with cash and well-capitalized buyers leading. |
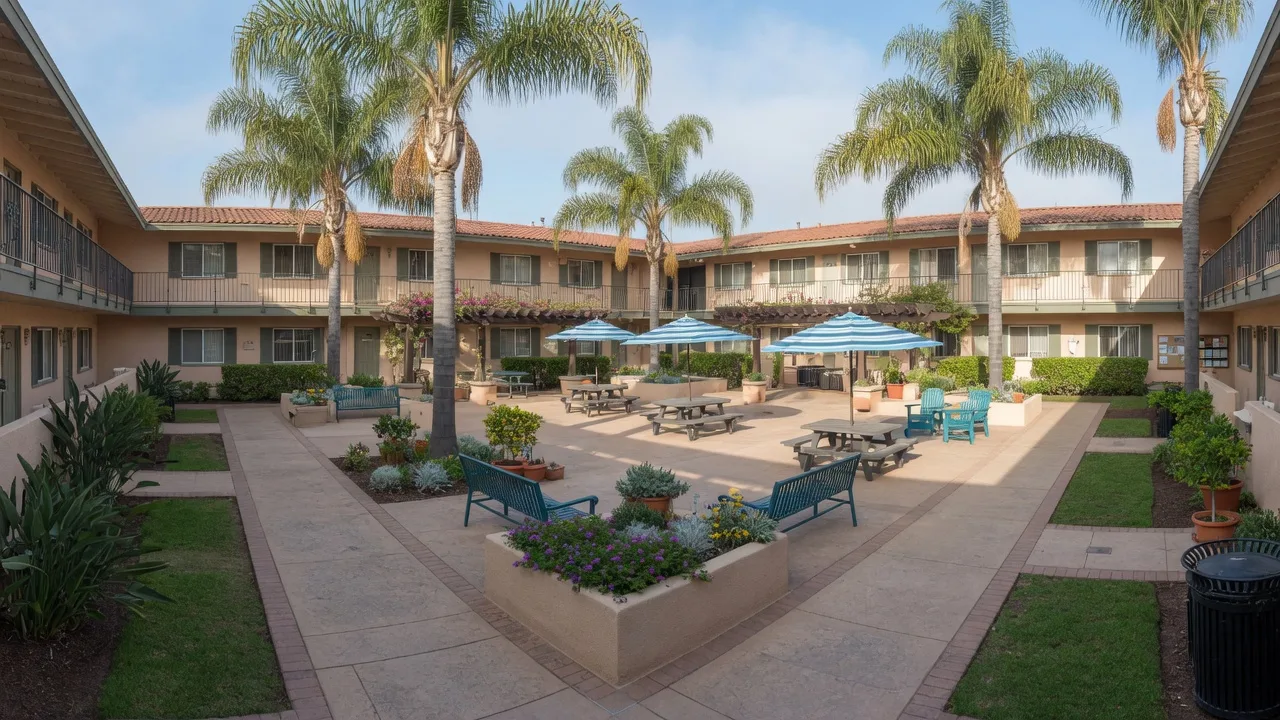
At repriced values, the asset that cash-flows today is the one worth buying. Workforce product, not the trophy, carries the yield in Q4 2026.
Office bottoms, industrial absorbs, retail redevelops.
You cannot buy commercial real estate in Q4 2026 with one thesis. The vacancy, rent, and opportunity picture changes sector by sector, and the strategy changes with it.
County office vacancy held at roughly 14% to 15% in Q3 2026 with total availability near 18%. The news is the direction: vacancy fell about 20 basis points quarter over quarter and year over year, and year-to-date net absorption turned positive at about +27,700 square feet versus a nearly 586,000 square foot loss a year earlier.
Industrial vacancy climbed from a 2.6% cyclical low in 2022 to roughly 7% to 9% as a wave of new supply delivered, including Amazon’s roughly one million square foot build-to-suit at 6980 Otay Mesa Road in early 2026. Otay Mesa is the softest submarket at about 15.7% vacancy with more space still coming, but SoCal industrial leasing posted a five-year high in Q2.
Retail is the tightest of the three commercial sectors, with vacancy around 4.3% to 4.6% and asking rents rising, roughly $2.42 per square foot NNN in early 2026, up about 5.6% year over year. The defining theme is redevelopment: old centers being converted, densified, and re-tenanted rather than newly built.
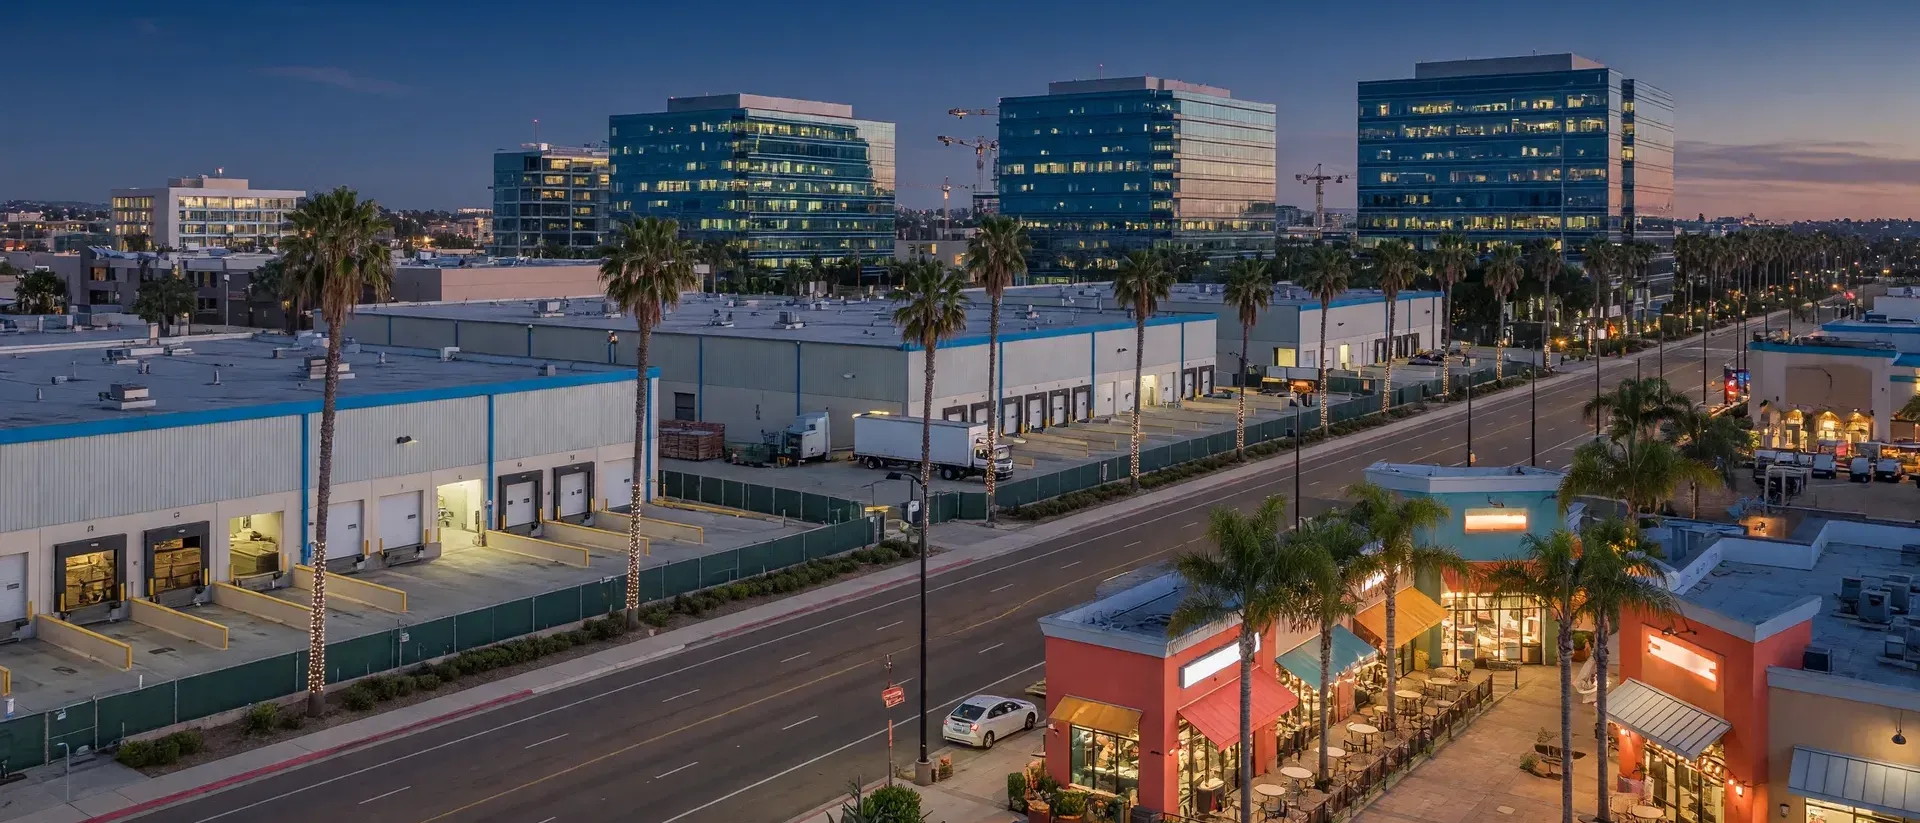
Office, industrial, and retail in one frame: three vacancies, three rent trajectories, and three distinct entry points heading into 2027.
Four moves that work in the Q4 window.
Buy the Repriced Door
Average price per unit is down roughly 19% year over year even as Q3 sales volume accelerated back toward 2025 levels. That combination, lower prices with recovering liquidity, is the classic window for well-capitalized buyers who can act while asking prices still reflect the old cycle.
Follow Yield to Workforce Product
Class A buildings ran about 11.4% vacant in Q3 while Class B and C workforce stock held at roughly 2.5% to 4%. Financing at 7.28% turns the deal on cash flow, and workforce product delivers it, with inland and South Bay submarkets clearing the county average cap rate.
Underwrite a Normalized 2027 Rents
Stabilize on today’s rents near $2,400 to $2,600 per unit and model effective-rent growth of about 1% to 1.5% a year. Do not buy on record 2022 levels, and budget concessions on any Class A lease-up competing with the tail of the delivery wave.
Pick Sides in Commercial
Office is a bottom-picking, patient game concentrated in stabilized submarkets and conversion candidates. Industrial rewards buyers who time lease-up in absorbing corridors. Retail rewards repositioning. One commercial bet no longer fits the whole market, so structure each by its sector.
What could go wrong in the months ahead?
The cap rate to debt-cost gap at 7.28%
With financing costs in the mid-7% range on the 30-year and average apartment cap rates near 4.9%, positively levered cash flow is thin. Deals rely on equity, realistic underwriting, and holding-period improvements, not on a quick refinance.
Class A lease-up and concessions
Four- and five-star buildings are the softest part of the market, running about 11.4% vacant in Q3. Any trophy acquisition near the tail of the delivery wave must carry concession and lease-up costs in the model.
Industrial oversupply in Otay Mesa
Otay Mesa vacancy sits near 15.7% with roughly 750,000 square feet more delivering in the second half of 2026. Timing matters: early lease-up tenants anchor the asset, late arrivals negotiate against a softer market.
Downtown office availability
Downtown availability still approaches 36% even as the county’s office net absorption turns positive. Value is real, but holding periods are long and vacancy risk concentrates in the urban core unless the asset converts or re-tenants.
Frequently asked questions.
Is San Diego apartment vacancy finally turning?
Is San Diego apartment vacancy finally turning?
Is Q4 2026 a good time to buy an apartment building in San Diego?
Is Q4 2026 a good time to buy an apartment building in San Diego?
What is happening to apartment prices per unit in San Diego?
What is happening to apartment prices per unit in San Diego?
What is the office market doing, and is it investable?
What is the office market doing, and is it investable?
Which commercial sector is tightest in San Diego?
Which commercial sector is tightest in San Diego?
What should I do before year-end with a multifamily or commercial asset?
What should I do before year-end with a multifamily or commercial asset?
Go deeper on San Diego investing.
Position your portfolio
in this cycle.
Whether you are evaluating your first small multifamily, repricing a larger apartment portfolio, or picking a side in the commercial market, our team can help you underwrite at today’s rents and today’s money.