
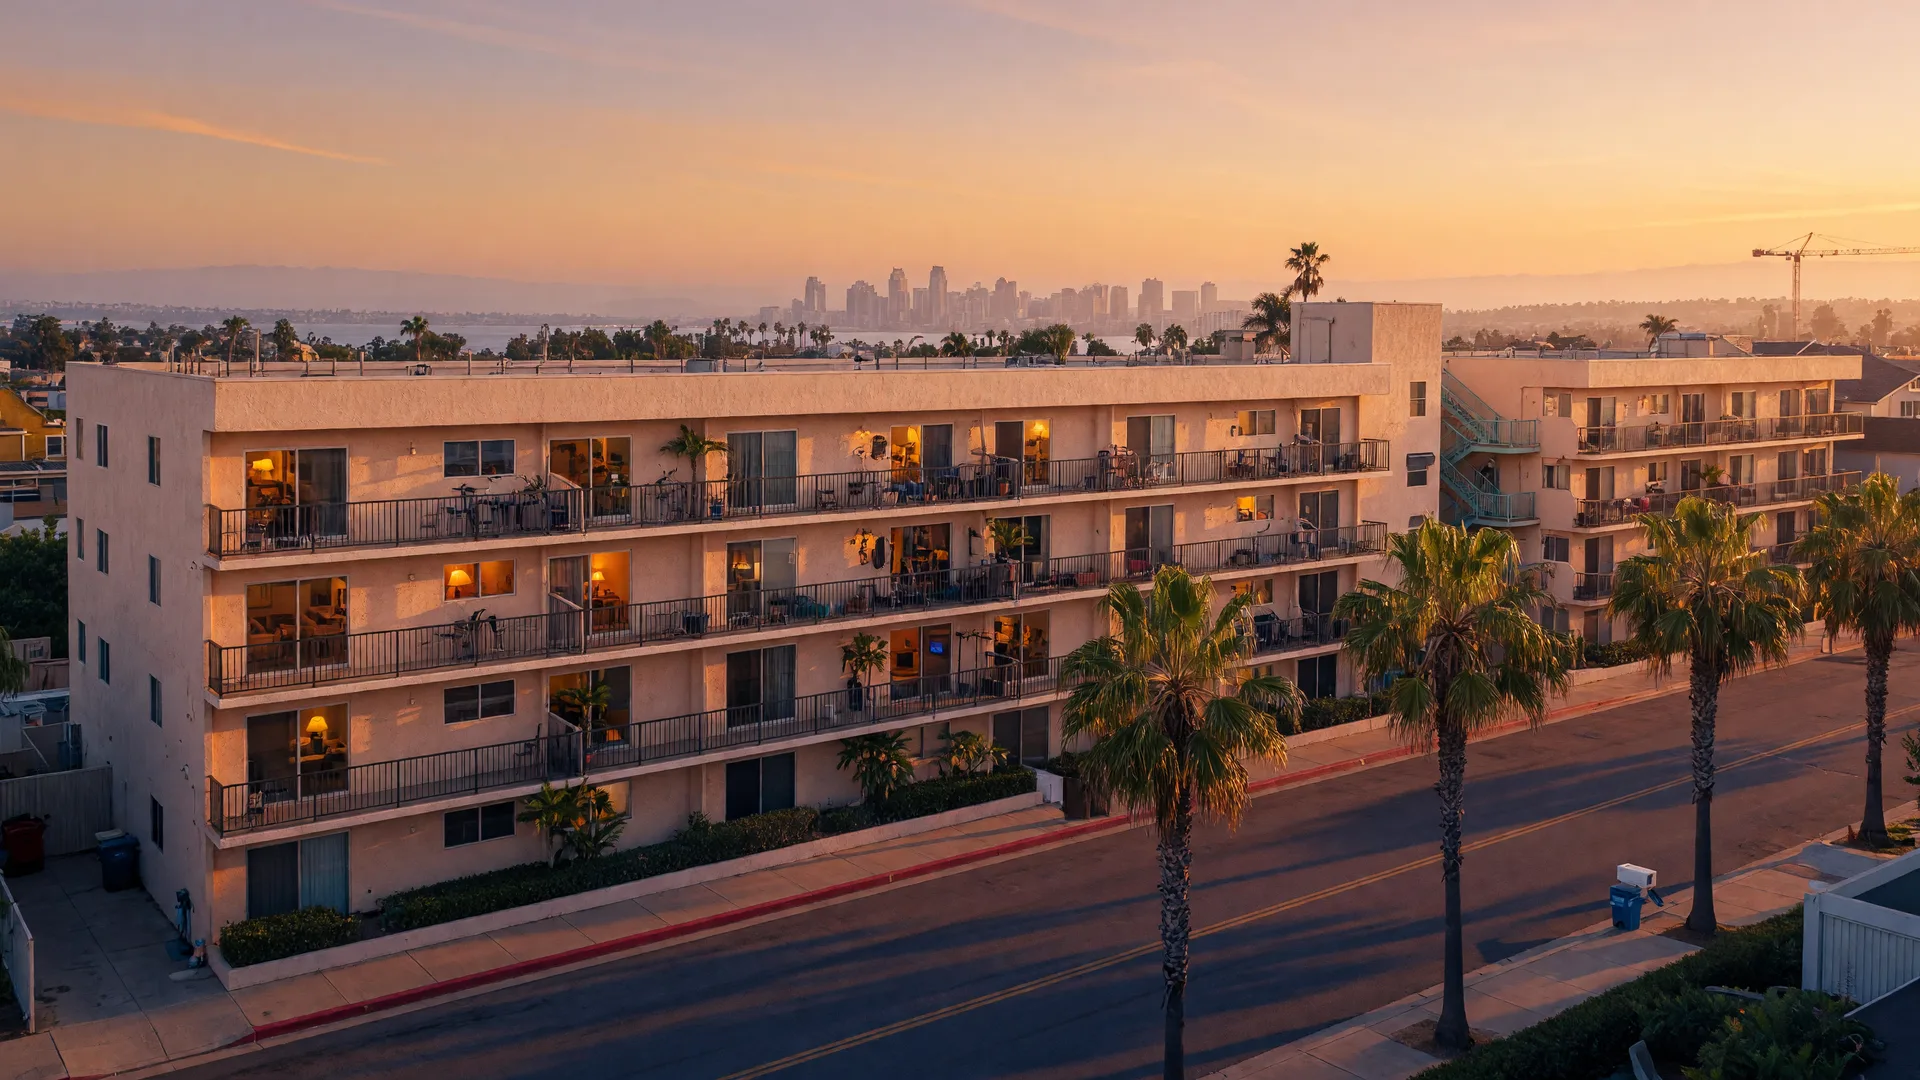
The 2026 multifamily reset: supply peaks, rents stabilize, and the buying window opens.
San Diego apartment vacancy sits at a multi-year high while rents finally turn positive, and the construction pipeline is shrinking for the first time in years. Here is what the supply wave means for cap rates, price per door, and where to acquire in late 2026 and 2027.
The largest apartment delivery wave of this cycle is landing just as San Diego vacancy reaches a multi-year high: about 5.9% according to industry trackers. That sounds like bad news, and for owners facing lease-up fights it is. But the same numbers describe a rare acquisition window. Rental growth has already turned positive after last year's dip, the pipeline of new construction is down roughly 21% year over year, and sellers are pricing concessions into offers. For well-capitalized buyers, late 2026 is looking like the best window to acquire San Diego multifamily with realistic underwriting since the rate environment turned. This guide walks through the supply data, the rent cycle, the submarkets that still clear at 5% to 6%+ cap rates, and how to position a portfolio through 2027.
A multi-year high and the market's biggest weakness plays right into the strongest negotiating position buyers have had in years.
Asking rents are up about 0.8% year over year and effective rents are expected to rise about 1.2% in 2026, after a near-2% decline last year.
New supply peaks in 2026 with about 5,900 to 6,000 deliveries, while the under-construction pipeline shrinks about 21% year over year.
City Heights, National City, and the South Bay clear 5% to 6.3% caps against the 4.7% county median, while coastal cores sit at 3.5% to 4.5%.
Multifamily real estate operates on a slower cycle than single-family housing. The San Diego market is now mid-cycle: supply surge in rearview, vacancy and rent to bottom, and readiness returning.
San Diego's apartment market has spent two years absorbing the biggest wave of new construction in years. Between 2023 and 2026, multifamily inventory grew roughly 6.3%. Vacancy, which sat near 4.9% in the second quarter of 2025, climbed to 5.4% in the first quarter of 2026 and about 5.5% in the second, the highest in roughly 15 years, according to Kidder Mathews. Even so, the county is tighter than the 6.8% national average, a reminder of how structurally undersupplied San Diego has historically been.
The overdue market has begun to hit its bottom. Average asking rent reached about $2,453 per unit per month in the second quarter of 2026, up 0.8% from a year earlier, and forecasters expect effective rents to rise around 1.2% for the full year, reversing the roughly 2% decline recorded in 2025. Early lease-up and concessions, everything that hurt net operating income last year, are turning on at a slower pace.
The clearest signal for buyers is the pipeline. San Diego had about 11,800 multifamily units under construction at the end of the second quarter of 2026, down roughly 21% from about 14,900 a year earlier. Deliveries will still be heavy in 2026, perhaps 5,900 to 6,000 units, but the number of new starts has collapsed. What that means is that the supply surge crests this year, and the market has the ingredients for a rent recovery as the 2026 and 2027 completions absorb.
For investors, this alignment of slow vacancy and soft rents with a shrinking pipeline is exactly where the best entry points usually form. Median cap rates around 4.7%, price per door in the range of $330,000 to $400,000, and inland submarkets that still clear above 5% all describe a market where yield is to be found farther from the coast. The rest of this guide lays out the data and the playbook.
The apartment boom is peaking right now.
Reading the delivery schedule tells you most of what you need to know about the market’s near-term balance. Every row below is a current figure for 2026.
| Metric | Current Reading | What It Means |
|---|---|---|
| Units under construction | About 11,800 (Q2 2026) | A large but shrinking pipeline for San Diego, still one of the biggest in California relative to housing stock. |
| Pipeline change year over year | Down about 21% | Fewer new starts mean the delivery wave crests in 2026, and newly built supply will taper into 2027. |
| Expected 2026 deliveries | About 5,900 to 6,000 units | The highest annual volume of new apartments this cycle, most of it concentrated in Mission Valley and the urban core. |
| 2025 completions | About 5,500 to 6,200 units | The deliveries that drove most of the vacancy increase over the past year. |
| Inventory growth since 2023 | About 6.3% | Supply has grown faster than demand, which is why vacancy climbed to its multi-year high. |
| Headline projects coming online | Hines Riverwalk (721 units) and Avalon Mission Valley (621 units) | Both in Mission Valley, these large projects show where the heaviest local lease-up competition will concentrate. |
The bottom is forming on rents.
Vacancy is high enough to hurt owners, but the worst of the rent decline is behind the market. These are the four numbers to track toward the next cycle.
Q2 2026, up 60 basis points from 4.9% a year earlier. The highest level in about 15 years, though San Diego remains tighter than the 6.8% national average.
Quarterly average asking rent per unit in Q2 2026, up about 0.8% from $2,433 in Q2 2025.
Forecasters expect vacancy to settle near 5% for the full year as the heaviest deliveries fall behind us and leasing catches up.
Moody’s expects average effective rents to rise about 1.2% in 2026, reversing the roughly 2% decline recorded in 2025.
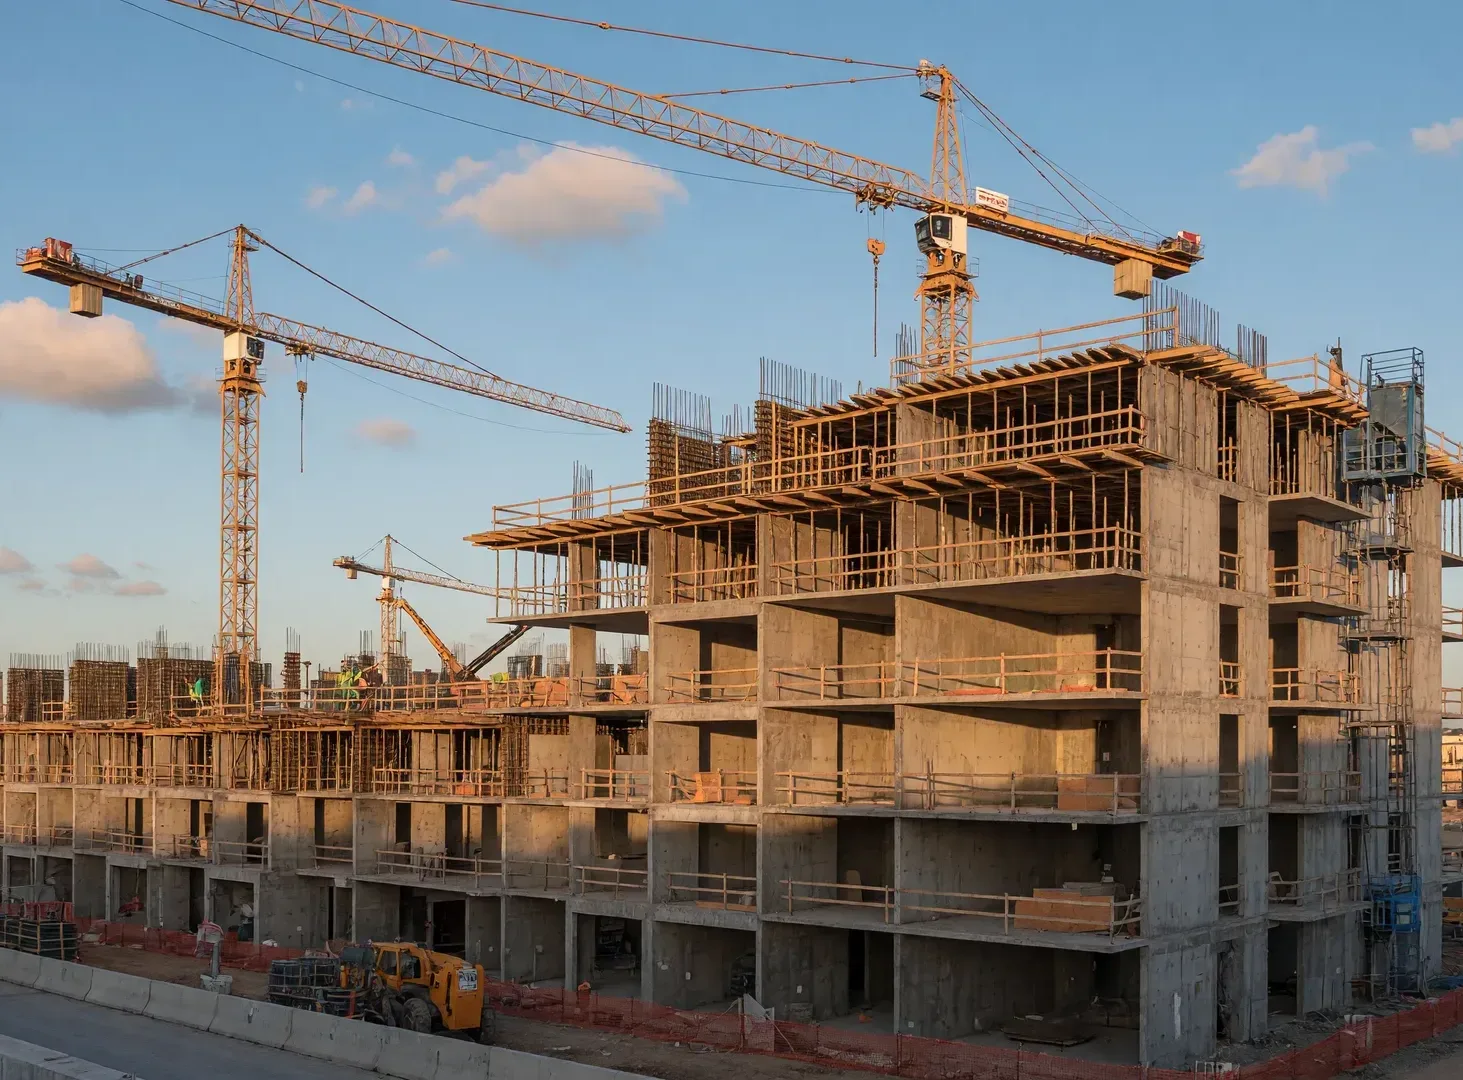
New deliveries concentrate in Mission Valley and the urban core. The pipeline peak is the turning point investors are waiting for.
Cap rates by submarket: yield lives inland.
The same supply wave and rate environment priced differently across the county. Cap rates are just one lens, but submarket to submarket, the spread can change the shape of an entire deal.
| Submarket | Typical Cap Rate | Inventory Profile | Best Fit For |
|---|---|---|---|
| City Heights | About 6.3% | The county’s strongest cash-flow submarket, with typical smaller buildings near $525,000 and unit rents around $2,100 per month. | Yield-first investors on a 2- to 4-unit scale |
| Barrio Logan | About 5.8% | Redeveloping South Bay submarket with solid rent momentum and entry prices below the coastal core. | Value-add buyers with a longer hold |
| National City | About 5.2% | Among the lowest median entry prices in the county, close to $550,000, with defensive renter demand. | Cash-flow buyers scaling a portfolio |
| El Cajon, Chula Vista, Encanto, Paradise Hills, Southeast San Diego | About 5.0% to 6.3% | Inland and South Bay corridors where most deals deliver yields above the county median. | Risk-adjusted yield with a path to rent growth |
| Coastal core (La Jolla, Pacific Beach, North Park) | About 3.5% to 4.5% | Blue-chip addresses with the lowest cap rates and the strongest long-term appreciation profile. | Appreciation plays for well-capitalized investors |
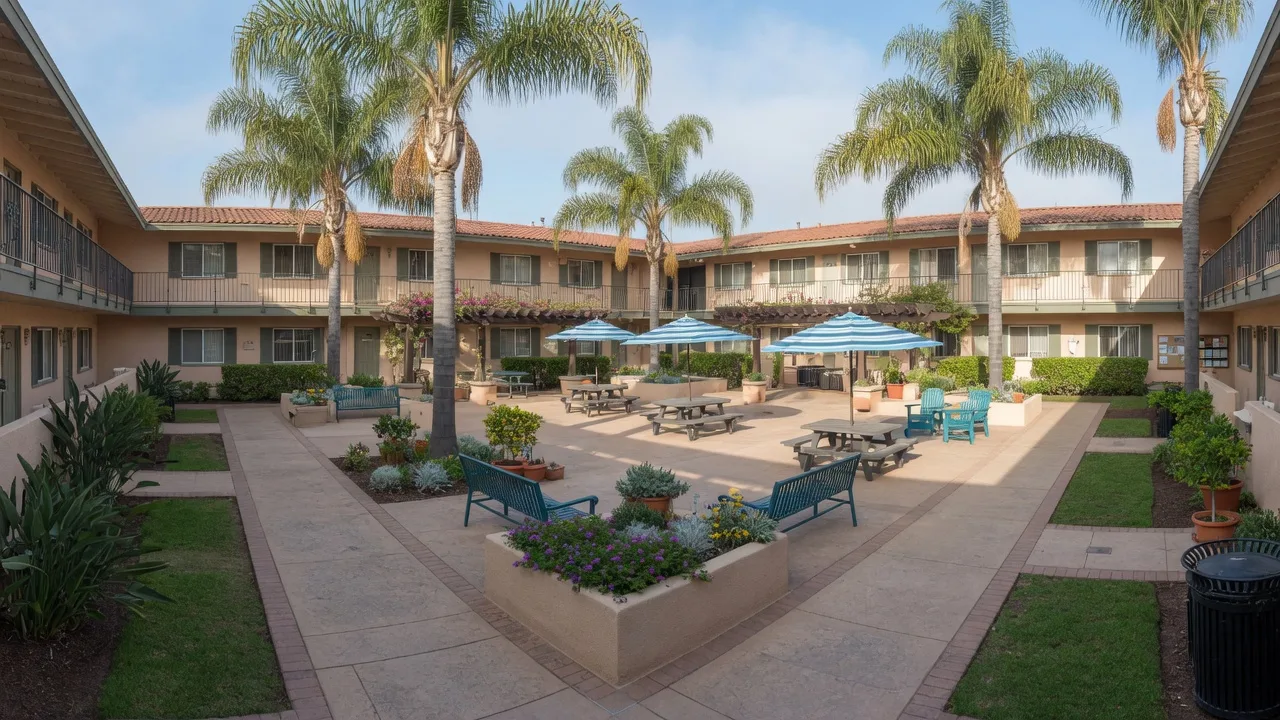
Amenities drive lease-up in a high-vacancy market. Inland value corridors put that rent you collect to work on returns.
Four moves that work in the 2026 window.
Acquire During the Vacancy Window
The most expensive time to buy was 2021 and 2022. Today, concession-driven vacancy, slower lease-ups, and sellers who have adjusted expectations create room to negotiate price per door. Deals that make sense at current rents, without assuming a refi, are the ones to pursue.
Target Inland and South Bay Value Corridors
City Heights, National City, Barrio Logan, El Cajon, and Chula Vista trade at 5% to 6.3% cap rates with price-per-unit well below the county average. In a high-rate market, that cash flow is the shock absorber.
Underwrite a Normalized 2027, Not a Peak 2022
Stabilize on today’s rents, near $2,300 to $2,500 per unit, not the record levels of a few years ago. Model effective-rent growth of about 1% to 1.5% a year as the pipeline tapers, and budget for concessions on first lease-up.
Watch The Delivery Calendar at the Block Level
New 700-plus-unit projects like Riverwalk and Avalon Mission Valley change the local vacancy picture for years. Favor submarkets where the delivery wave has already passed, or use pending supply as a negotiating point on price and closing terms.
What could go wrong in the months ahead?
Lease-up pressure into early 2027
The deliveries still hitting the market in late 2026 and 2027 will keep chasing tenants with concessions, which compresses net operating income on freshly acquired properties.
The cap-rate-to-debt-cost gap
With financing costs in the mid-6% range and cap rates near 4.7%, positively levered cash flow is thin. Acquisitions rely on equity, realistic underwriting, and holding period improvements.
Coastal price-per-door exposure
Trophy coastal assets trading above $400,000 per unit at 3.5% to 4.5% caps leave little margin for error if rates stay high or rents soften further.
A slower-than-expected absorption
If the 2026 deliveries lease up more slowly than forecast, vacancy stays elevated into 2027 and rent recovery shifts out, testing reserves on every new acquisition.
Frequently asked questions.
Why is San Diego apartment vacancy at a multi-year high?
Why is San Diego apartment vacancy at a multi-year high?
Is 2026 a good time to buy a multifamily building in San Diego?
Is 2026 a good time to buy a multifamily building in San Diego?
Where are the best cap rates for apartments in San Diego County?
Where are the best cap rates for apartments in San Diego County?
What does an apartment building cost per unit in San Diego in 2026?
What does an apartment building cost per unit in San Diego in 2026?
When will San Diego apartment rents recover?
When will San Diego apartment rents recover?
Go deeper on San Diego investing.
Build your apartment
portfolio in this cycle.
Whether you are evaluating your first small multifamily, assembling a larger portfolio, or exploring funding structures for a value-add deal, our team can help you underwrite at today’s rents and put realistic numbers behind the market’s next move.